

What would you like to understand?
Why is this forecast high or low?
Break one forecast into a starting value and the contribution from each
input.
What is the forecast sensitive to?
See how the forecast changes when one input is replaced by its typical
historical value.
Which signals have been useful historically?
Rank the features that have been most useful for predicting your target
over time.
I need more control
Compare relationship analyses, history-weighted forecast allocations, and
stability across data windows.
One example, three questions
The guides use the same retail example throughout: a store forecasts daily demand using price, promotion, and temperature.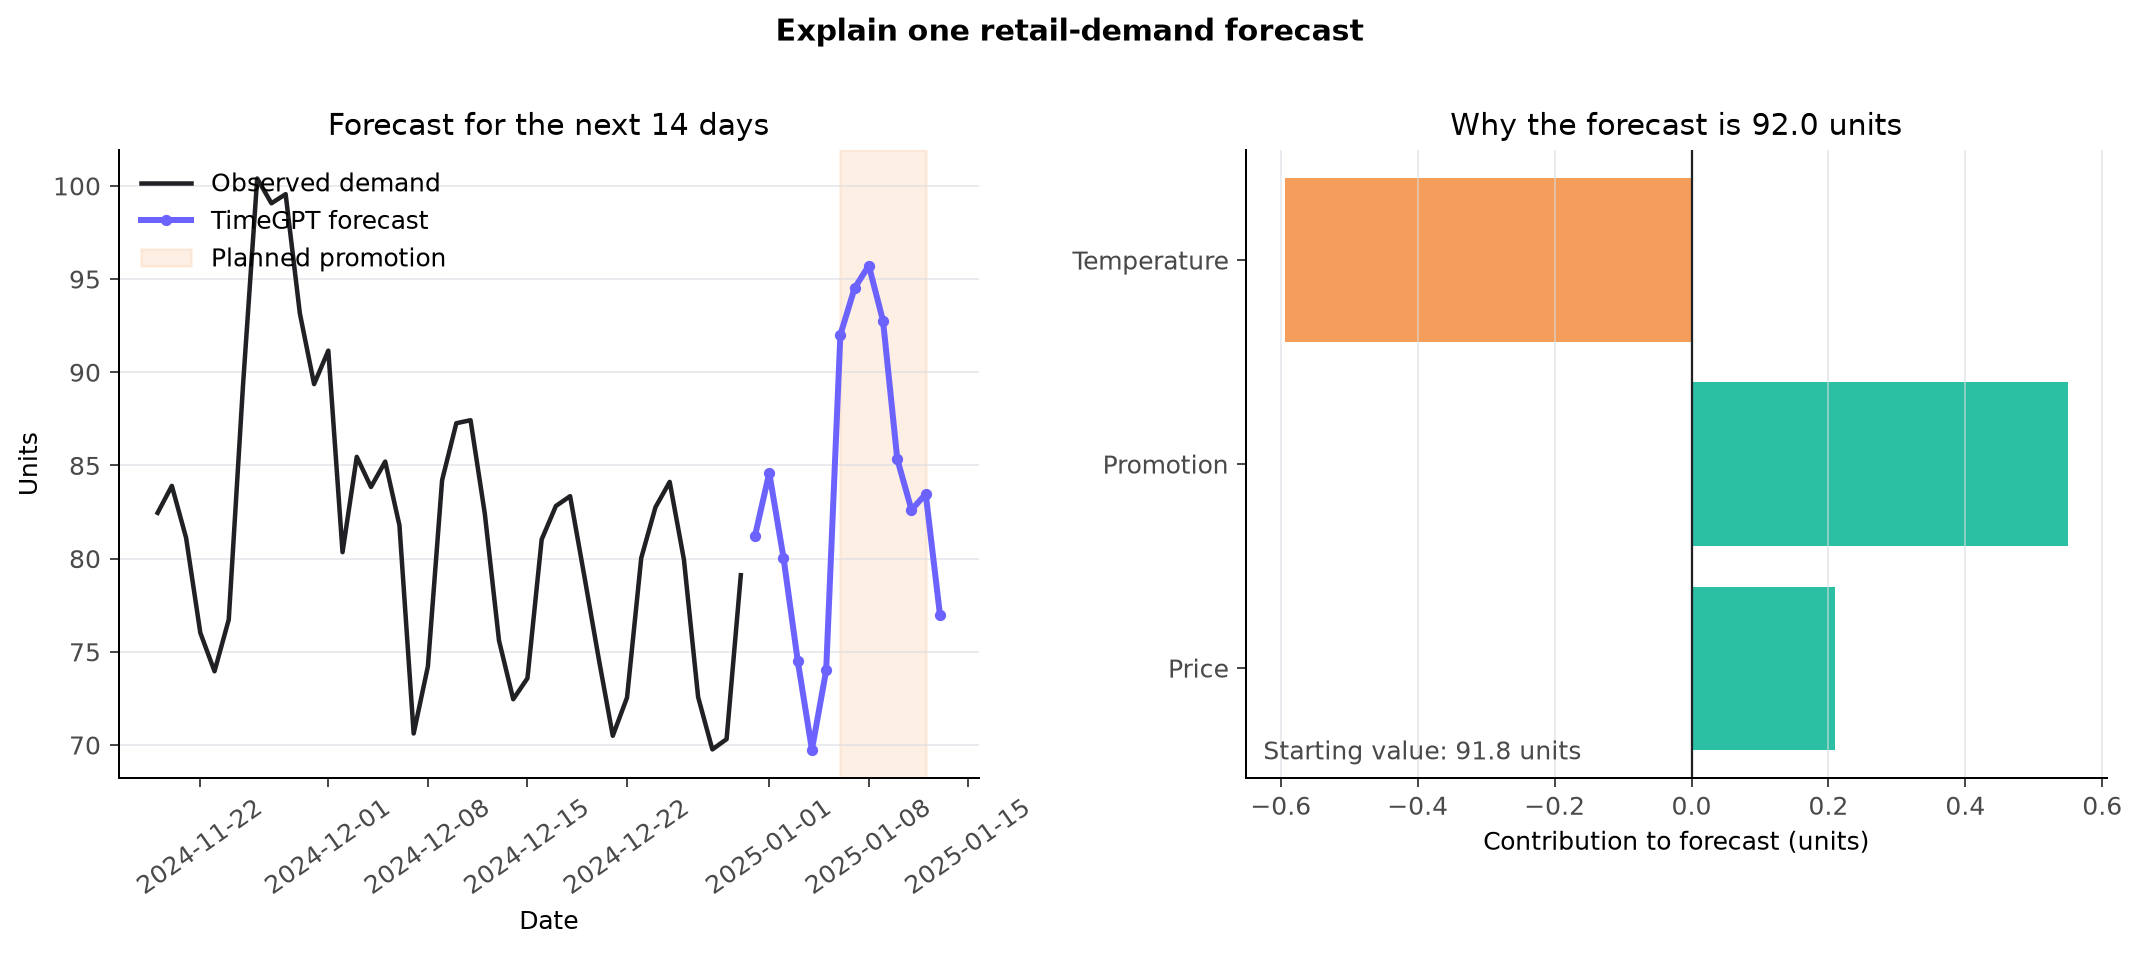
An actual TimeGPT 2.1 forecast and its feature contributions for one promotion day.
A simple rule
- Use SHAP to explain a forecast you already made.
- Use intervention to explore the forecast’s sensitivity.
- Use historical signals before forecasting or when reviewing your data.
Explanations are a practical way to investigate forecasts and prioritize
follow-up work. For a major business change, combine them with your normal
testing and decision process.