

What Are Holiday Variables and Special Dates?
Special dates, such as holidays, promotions, or significant events, often cause notable deviations from normal patterns in your time series. By incorporating these special dates into your forecasting model, you can better capture these expected variations and improve prediction accuracy.How to Add Holiday Variables and Special Dates

Step 1: Import Packages
This guide plots feature contributions with the SHAP library, which is not a dependency ofnixtla. Install it alongside matplotlib first:
Step 2: Load Data
We use a Google Trends dataset on “chocolate” with monthly frequency:Step 3: Create a Future Dataframe
When adding exogenous variables (like holidays) to time series forecasting, we need a future DataFrame because:- Historical data already exists: Our training data contains past values of both the target variable and exogenous features
- Future exogenous features are known: Unlike the target variable, we can determine future values of exogenous features (like holidays) in advance
Step 4: Forecast with Holidays and Special Dates
TimeGPT automatically generates standard date-based features (like month, day of week, etc.) during forecasting. For more specialized temporal patterns, you can manually add holiday indicators to both your historical and future datasets.Create a Function to Add Date Features
To make it easier to add date features to a DataFrame, we’ll create theadd_date_features_to_DataFrame function that takes:
- A pandas DataFrame
- A date extractor function, which can be
CountryHolidaysorSpecialDates - A time column name
Add Holiday Features
To add holiday features, we’ll use theCountryHolidays class to compute US holidays and merge them into the future DataFrame.
This DataFrame now includes columns for each identified US holiday as binary indicators.
Next, add holiday indicators to the historical DataFrame.
Now, your historical DataFrame also contains holiday flags for each month.
Finally, forecast with the holiday features.
 Passing
 feature_contributions=True stores a per-timestamp breakdown on the
client as nixtla_client.feature_contributions. Its columns are the ID and time
columns, TimeGPT, one column per feature, and base_value — the starting
point that the feature contributions add to in order to reach the forecast.
By default the contributions are Shapley values. Other explanations are
available through feature_contributions_type; see
Advanced explanations.
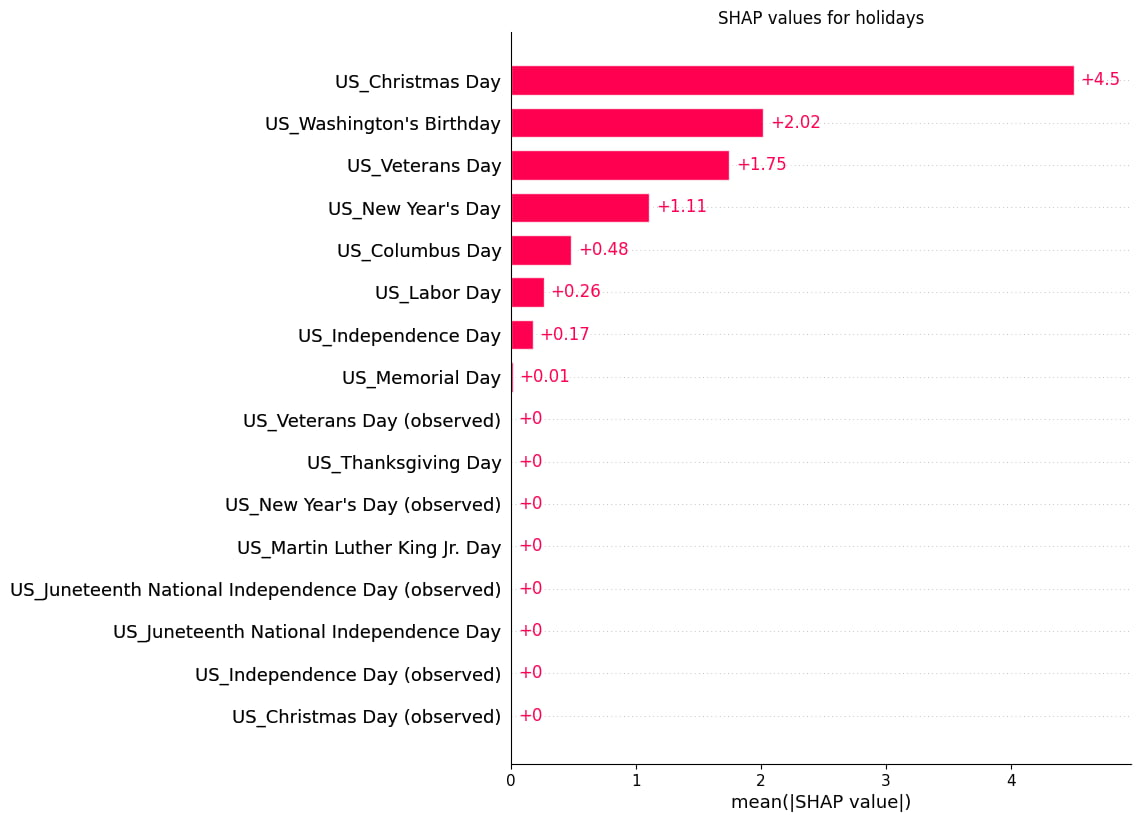
We can then plot the weights of each holiday to see which are more important in forecasting the interest in chocolate. We will use the SHAP library (installed in Step 1) to plot the weights.
The plotting code below only needs nixtla_client.feature_contributions from the forecast above. For how to interpret feature contributions, see our tutorial on model interpretability.
Add Special Dates
Beyond country holidays, you can create custom special dates withSpecialDates. These can represent unique one-time events or recurring patterns on specific dates of your choice.
Assume we already have a future DataFrame with monthly dates. We’ll create Valentine’s Day and Halloween as custom special dates and add them to the future DataFrame.
We will also add custom special dates to the historical DataFrame.
Now, forecast with the special date features.
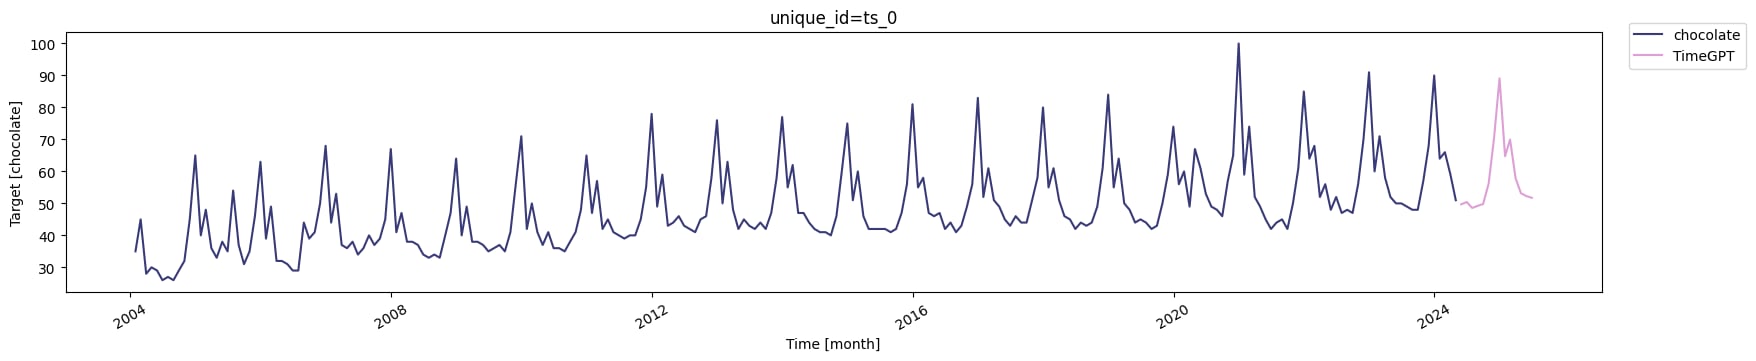
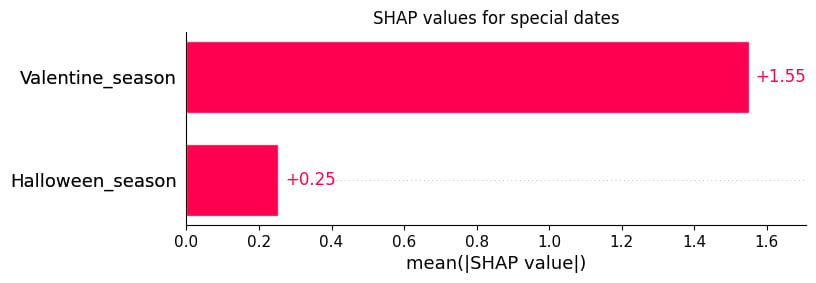
Congratulations! You have successfully integrated holiday and special date features into your time series forecasts. Use these steps as a starting point for further experimentation with advanced date features.