> ## Documentation Index
> Fetch the complete documentation index at: https://nixtla-enterprise-feat-simulate-and-explain.mintlify.site/llms.txt
> Use this file to discover all available pages before exploring further.
# Understanding forecasts
> Choose the explanation that matches the question you want to answer.
TimeGPT can help you understand both a forecast and the historical information
behind it. Start with the question you are trying to answer.
## What would you like to understand?
Break one forecast into a starting value and the contribution from each
input.
See how the forecast changes when one input is replaced by its typical
historical value.
Rank the features that have been most useful for predicting your target
over time.
Compare relationship analyses, history-weighted forecast allocations, and
stability across data windows.
If you have a forecast in front of you and are unsure where to start, choose
[Explain a forecast with SHAP](/forecasting/exogenous-variables/interpretability_with_shap).
## One example, three questions
The guides use the same retail example throughout: a store forecasts daily
demand using price, promotion, and temperature.
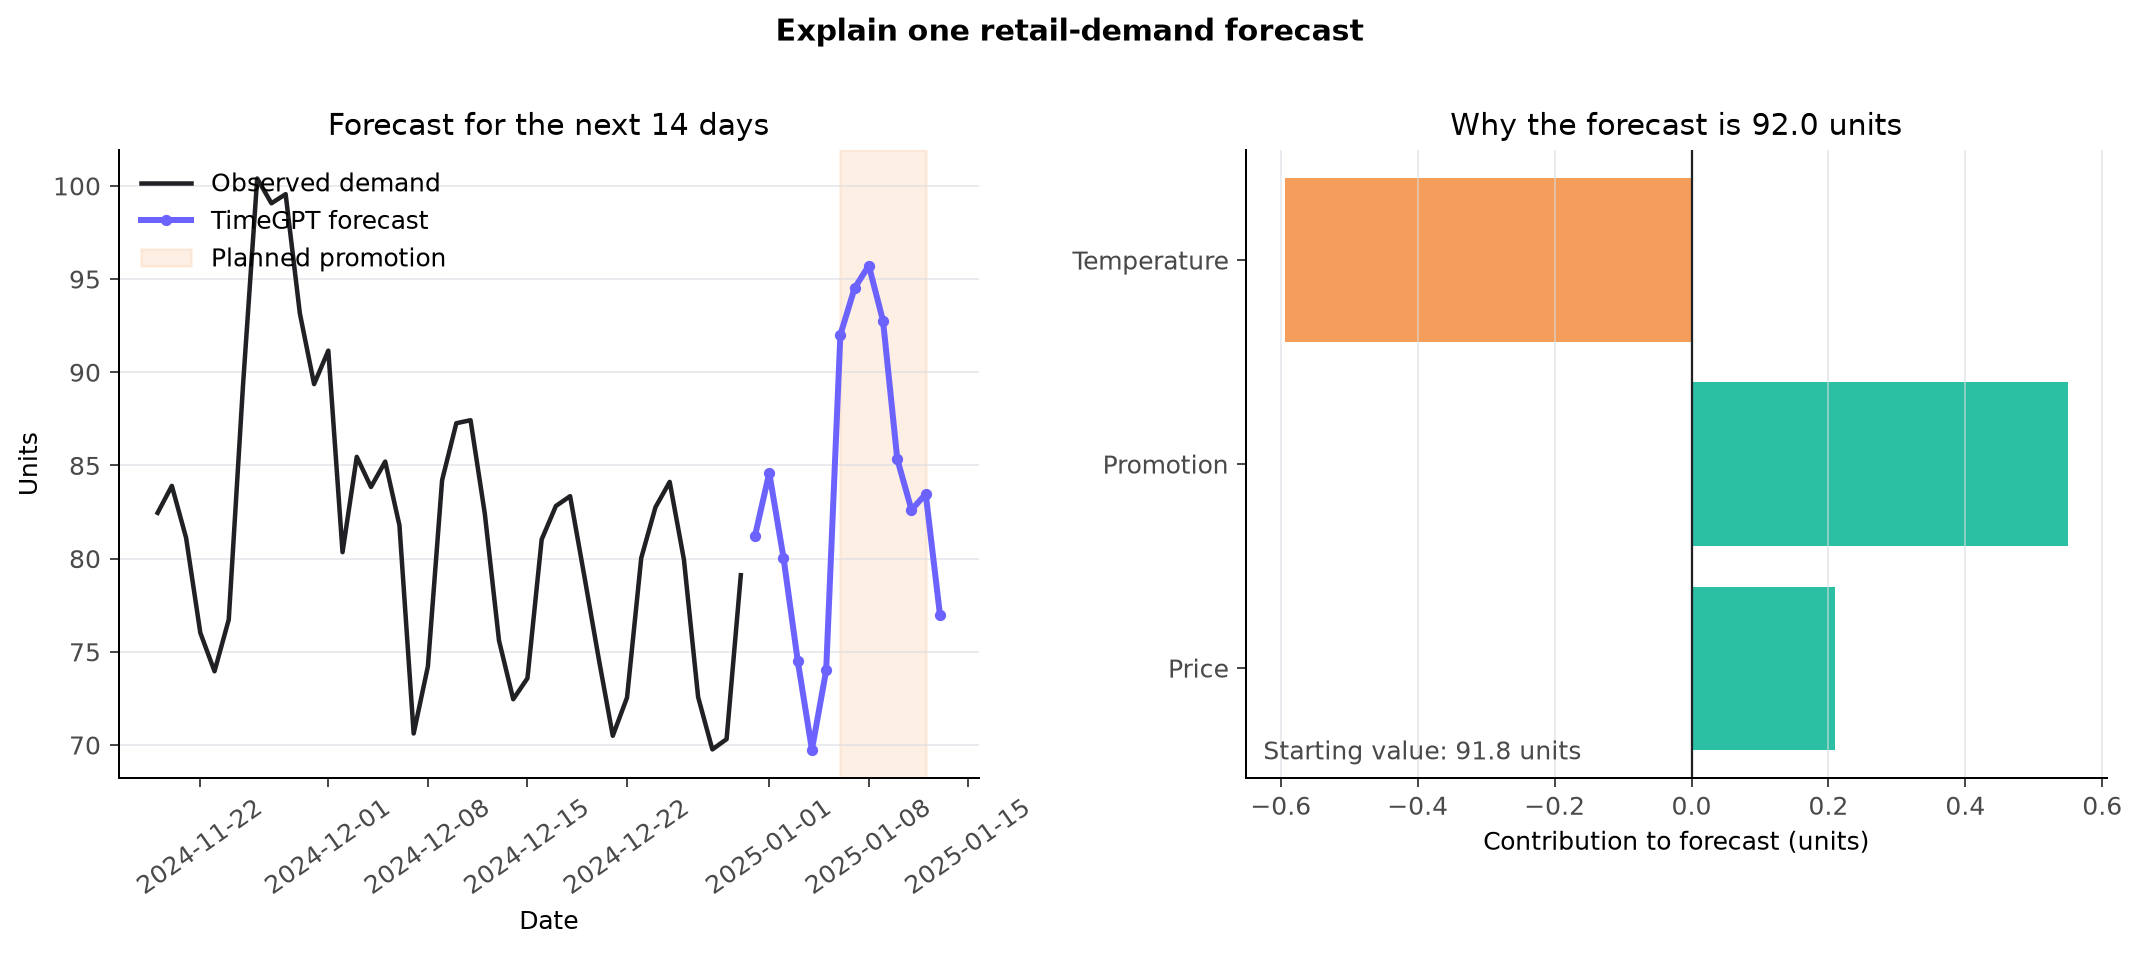 Each guide looks at this example from a different angle:
| Question | What you learn |
| ----------------------------------------------------- | --------------------------------------------------------------------- |
| Why did TimeGPT forecast 92 units on this day? | How price, promotion, and temperature moved that forecast up or down |
| What changes when an input is set to a typical value? | Which inputs the forecast is most sensitive to over the next 14 days |
| Which signals have been useful over the last year? | The relative historical strength of price, promotion, and temperature |
## A simple rule
* Use **SHAP** to explain a forecast you already made.
* Use **intervention** to explore the forecast's sensitivity.
* Use **historical signals** before forecasting or when reviewing your data.
Explanations are a practical way to investigate forecasts and prioritize
follow-up work. For a major business change, combine them with your normal
testing and decision process.
## Next
Start with [Explain a forecast with
SHAP](/forecasting/exogenous-variables/interpretability_with_shap), or go
directly to [Test forecast
sensitivity](/forecasting/explanation/intervention).
Each guide looks at this example from a different angle:
| Question | What you learn |
| ----------------------------------------------------- | --------------------------------------------------------------------- |
| Why did TimeGPT forecast 92 units on this day? | How price, promotion, and temperature moved that forecast up or down |
| What changes when an input is set to a typical value? | Which inputs the forecast is most sensitive to over the next 14 days |
| Which signals have been useful over the last year? | The relative historical strength of price, promotion, and temperature |
## A simple rule
* Use **SHAP** to explain a forecast you already made.
* Use **intervention** to explore the forecast's sensitivity.
* Use **historical signals** before forecasting or when reviewing your data.
Explanations are a practical way to investigate forecasts and prioritize
follow-up work. For a major business change, combine them with your normal
testing and decision process.
## Next
Start with [Explain a forecast with
SHAP](/forecasting/exogenous-variables/interpretability_with_shap), or go
directly to [Test forecast
sensitivity](/forecasting/explanation/intervention).